In the private beta phase of our full replacement of StatsWales, it was vital we pushed the new platform to its limits. Ensuring a service that would work for all of Wales.
Every year, almost 300,000 users rely on the data on StatsWales, the Welsh Government’s service for publishing statistics about Wales. Data about agriculture, the labour market, education, healthcare and much more. From data scientists analysing millions of data points, to school students looking for a single fact for their homework, StatsWales is an authoritative source of evidence about Wales.
In our 8-week discovery phase, we validated the case for replacing the legacy StatsWales service and defined the user needs and requirements for its replacement. Not long after, we presented the recommendations from an 8-week alpha phase to our client, the Welsh Government’s Knowledge and Analytical Service. In only 16 weeks, we were ready to start building in private beta.
The main priority identified in discovery and alpha was how we could create a more consistent user experience across datasets on StatsWales.
StatsWales contains a huge variety of statistics. Some with similar variables, such as dates and times, some with variables unique to one specific dataset. And many with multiple variables, with thousands of data points. Feedback on the legacy public site indicated consumers often found it difficult to find, filter and manipulate these complex statistics.
In the legacy platform, publishers would try to combat this complexity by breaking down large datasets into ‘views’ - pre-filtered versions of the datasets showing only a subset of the total number of data points. However, as these different views sometimes only differed by the inclusion or exclusion of one specific variable in a dataset, consumers often found it difficult to distinguish between them. Making it challenging to identify the statistics consumers were actually interested in.
Publishers were further constrained by the legacy system as it couldn’t handle datasets above a certain size. They were forced to split these datasets up, adding further confusion to consumers.
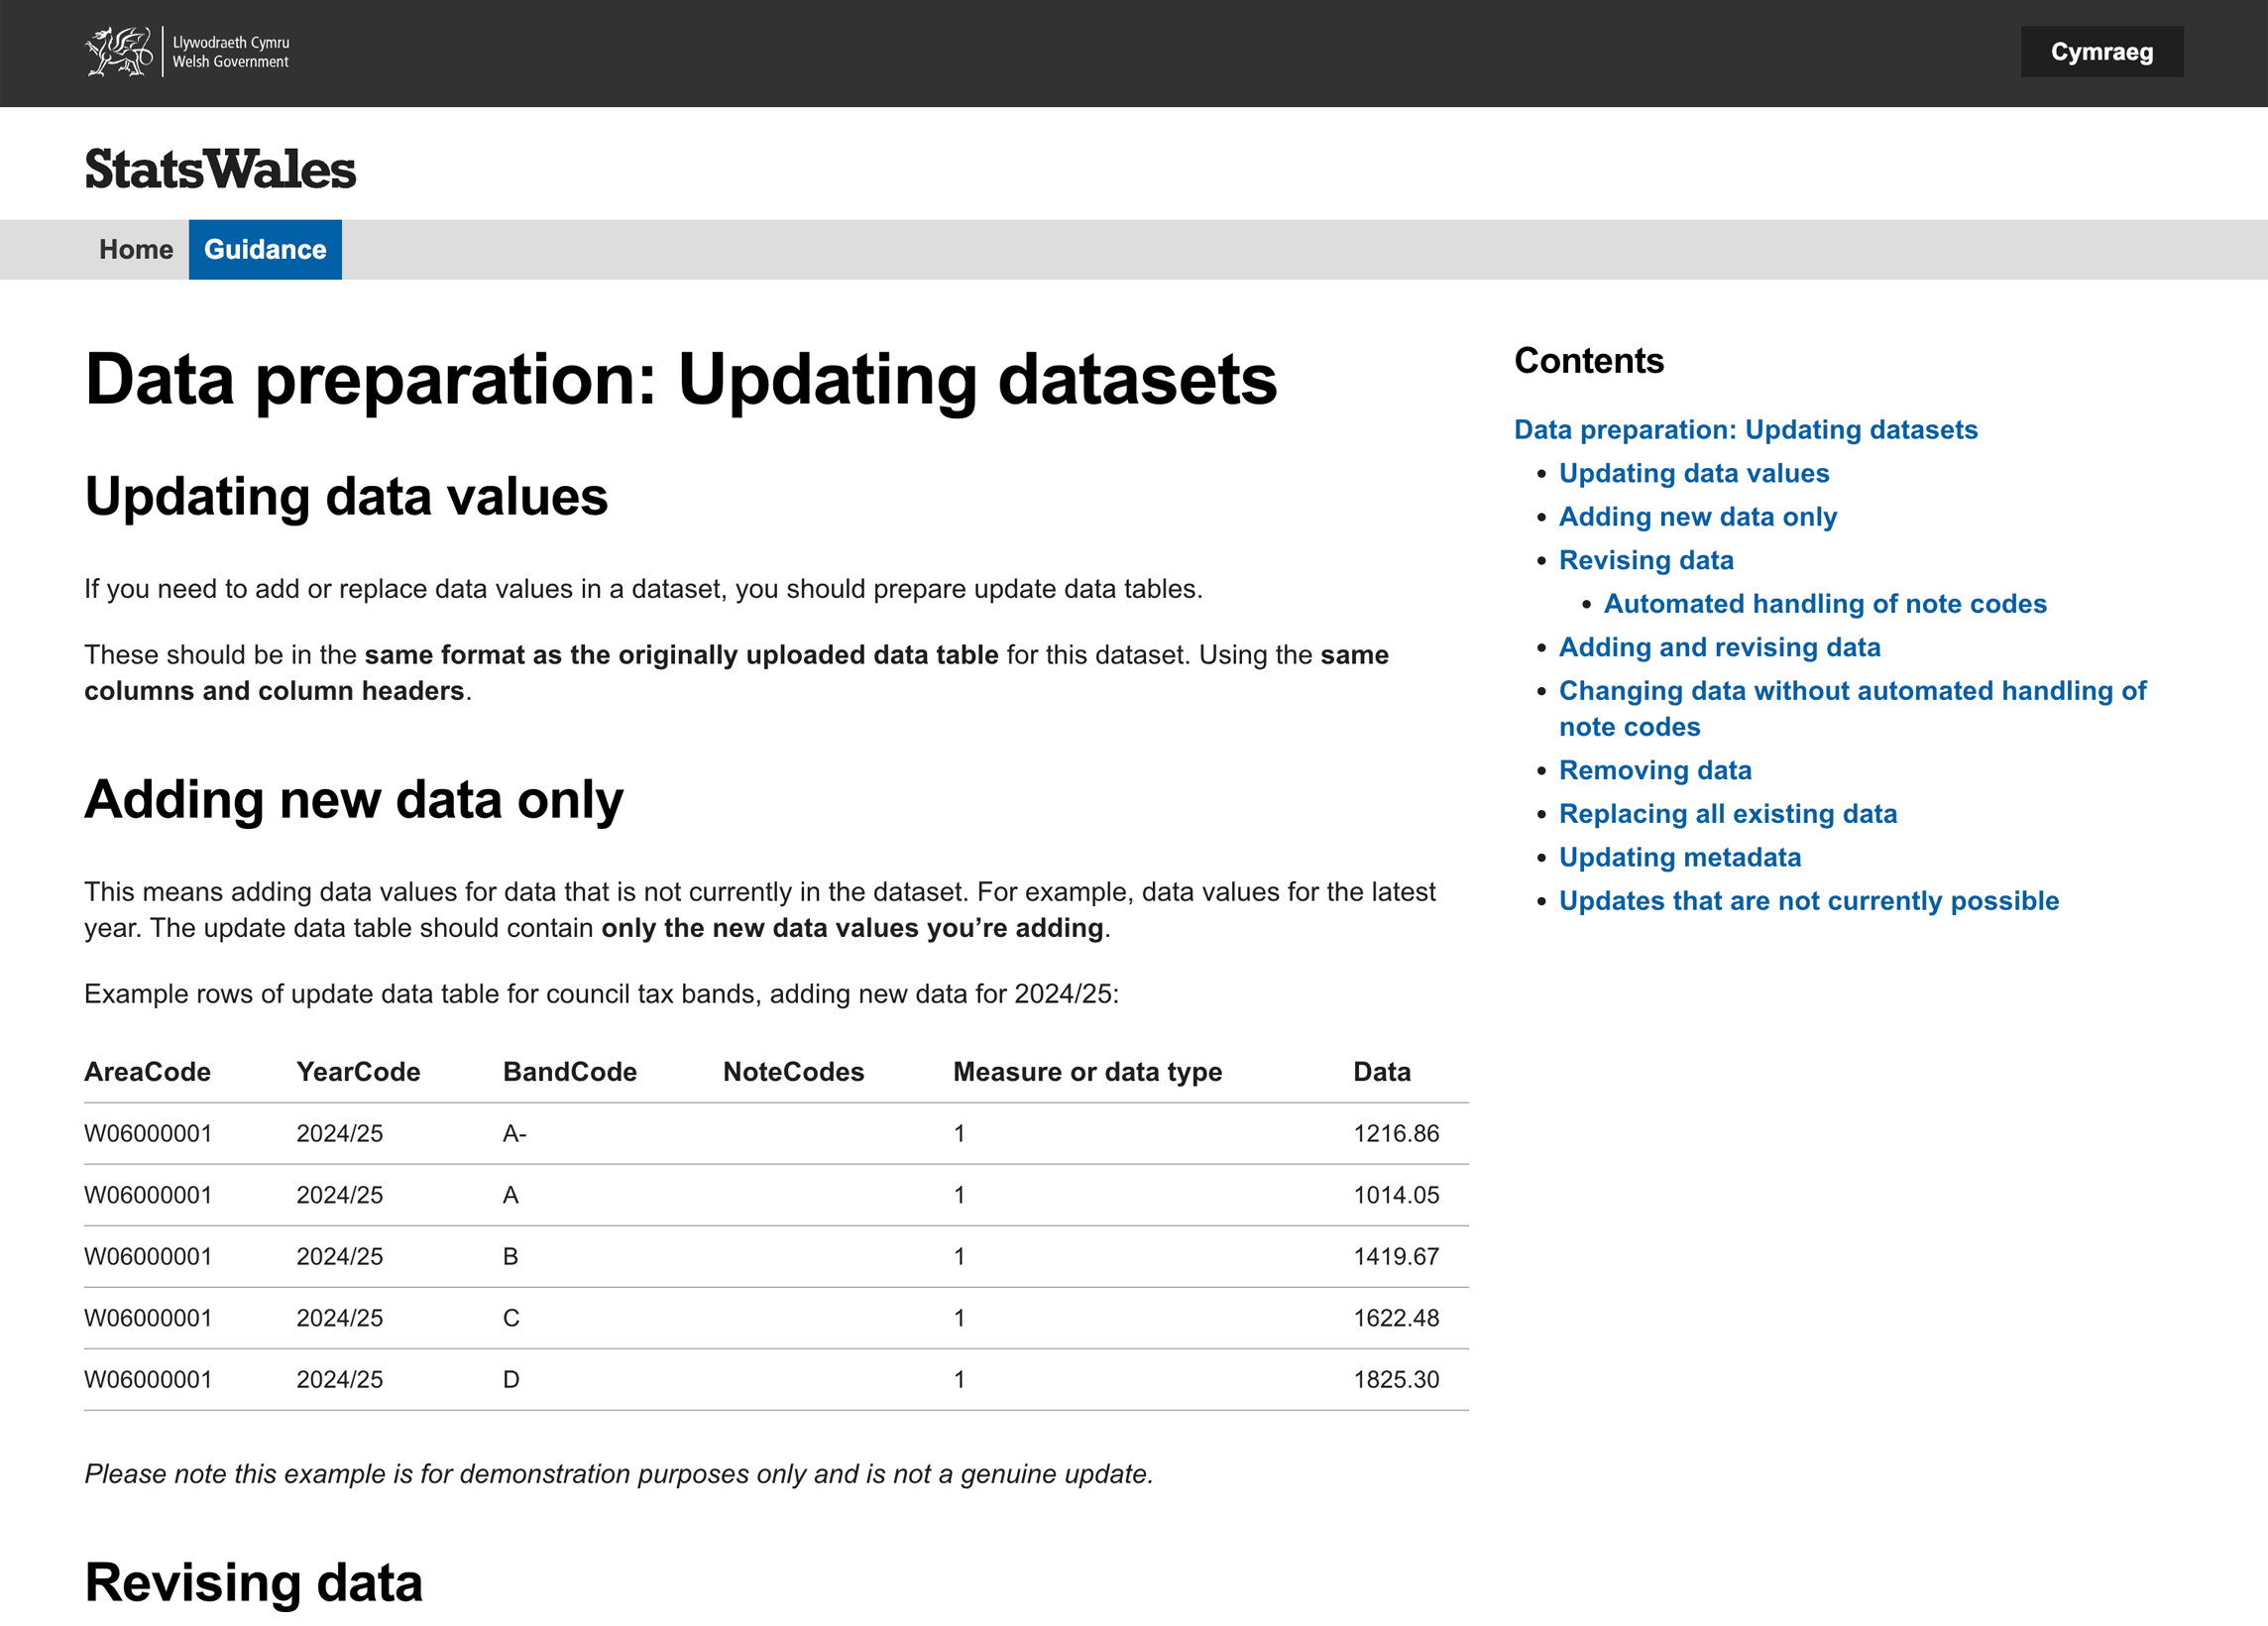
In alpha, we started building the new publishing platform in a way that would bring consistency to the consumer experience. We removed the need for publishers to create pre-filtered views or split up large datasets. And we designed comprehensive guidance alongside this to help publishers prepare their datasets correctly.
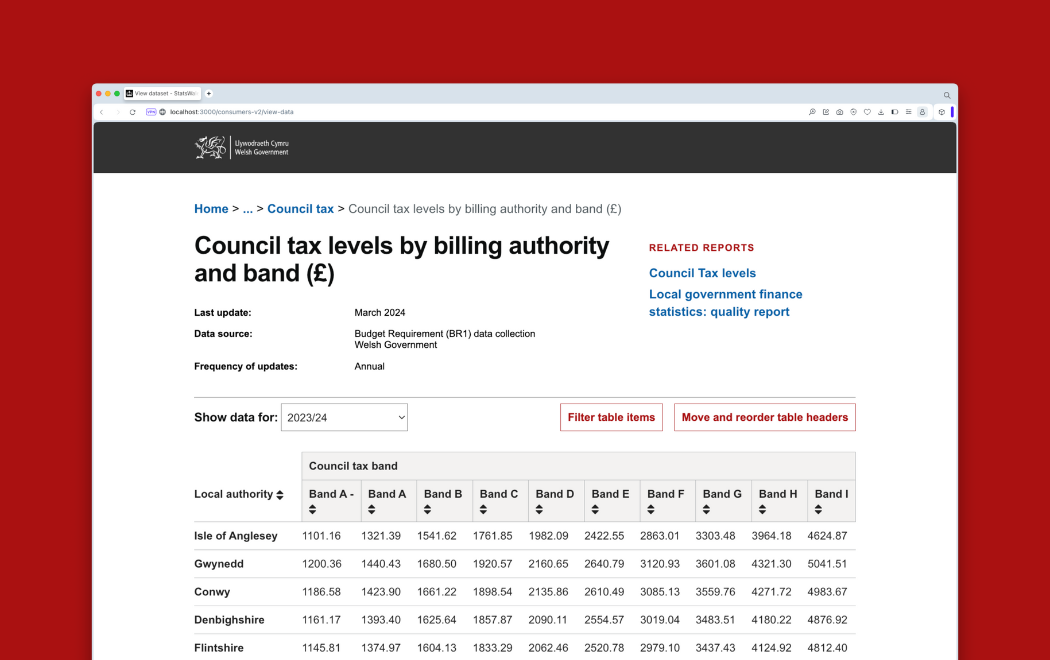
We also completely redesigned how datasets are organised and findable on the new consumer site. Datasets now only have a single link associated with them, but can be found under multiple relevant topics. Rather than being located only in one set place, as they were on the legacy site. We also designed and iterated improved filtering functionality which allows consumers to easily narrow down specific datasets to the statistics they’re after.
In beta, we built on this solid foundation, refining the publisher and consumer journeys further and introducing new protections to ensure better data quality and consistency.
How a user can filter a large dataset down to the one specific statistic they're interested inThe select number of publishers we tested with in alpha were able to successfully create datasets by following the guidance provided. However, as we scaled testing to a wider group of publishers in private beta, they experienced errors that we hadn’t anticipated, and therefore hadn’t designed helpful error messages for. From spelling mistakes in column headings, to missing or duplicated data.
To address this, we refined the service with improved validation and clearer guidance. The system could now better protect against a wide range of unintentional errors in data preparation and provide more helpful recommendations on how publishers could resolve these issues. Ultimately reducing mistakes and ensuring better quality of published statistics for consumers.
"With more than 1,300 datasets, containing many millions of data points, we needed to ensure the new system could support any and all possible changes to statistics."
Datasets on StatsWales are also frequently updated with new data, often from the most recent year or quarter. Publishers need to be able to make these changes, without compromising any historical data. Consumers also need to be made aware of any caveats associated with any new or updated data values. For example, if there’s been a break in a time series, the consumer needs to know whether they can directly compare new data to data from a previous time period or not. With more than 1,300 datasets, containing many millions of data points, we needed to ensure the new system could support any and all possible changes to statistics.
In order to test the update process, we slowly scaled up what publishers could do. Starting with a rigid set of options that we knew from discovery reflected the most common updates. These rigid options prevented publishers from making unintentional changes. When publishers reported that they needed to do something beyond what the initial options allowed, we added more options, with the same protections against unintentional mistakes.
The service now provides great flexibility and robustness for creating and updating datasets, supported by significant protections against errors and help on how to solve them.
Whilst statistical errors in the legacy service were rare, there were also almost no built-in checks within the StatsWales platform. Leaving all the responsibility for preparation and quality assurance with publishers. The embedded, automated validation we developed in private beta protects the quality of data, standardises dates across the whole service and prevents missing and duplicate data values.
Publishers also have to prepare their datasets in English and Welsh, so the service is bilingual by default. Coupled with improved interaction and content design, publishers now have a system that they describe as 'straightforward', 'clear' and 'helpful'.
These improvements mean the statistics published on StatsWales are more consistent and more reliable. Alongside the completely redesigned navigation and filtering on the consumer site, the site’s usability has significantly improved. When we tested the new site, 33 of 34 participants completed all the tasks they were given perfectly. And the remaining participant only made one mistake on one of the tasks.
"This is a major milestone in how we publish and share statistics in Wales. The new [service is] more responsive, more user-friendly, and more aligned with how people work with data today." Stephanie Howarth, Chief Statistician, Welsh Government
"I think it’s a huge step forward… I found things quickly, which is the aim of the game." Consumer feedback from testing
We’ve focused on building a service that provides consumers with data quality and integrity they can trust. And an experience that’s consistent across the vast diversity of statistics that are published about Wales. No small thing, given the significant role StatsWales plays in providing evidence for decision making across Wales.
As we enter public beta, we’ll use quantitative and qualitative feedback to give us more insight into how we can continue to improve the service, for all users.
Visit the site at stats.gov.wales.
Whether you’re ready to start your project now or you just want to talk things through, we’d love to hear from you.
© 2025 Marvell Consulting • Privacy policy • Social value statement • Registered company number: 06223331